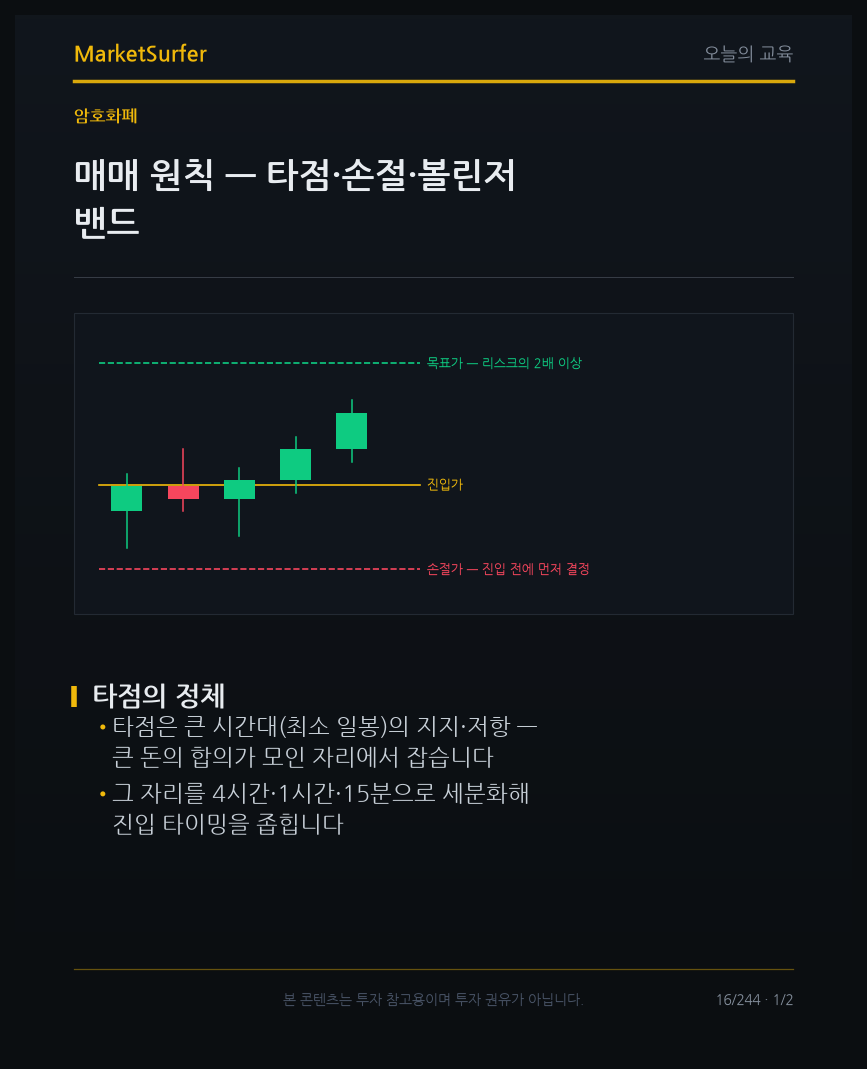

What an entry point really is
• An entry point is taken at support or resistance on a larger timeframe (daily at minimum) — a place where big money has reached agreement
• That spot is then subdivided into the 4-hour, 1-hour, and 15-minute charts to narrow the entry timing
What Bollinger Bands show
• Bollinger Bands are not a direction signal; they show the 'contraction expansion rhythm of volatility'
• Trend → squeeze (bands narrow) → expansion (large move) repeats — when the bands narrow, energy is compressed and a large move is near
Where people slip
• They mistake a band touch for a 'trade signal' — the bands describe the state of volatility, not direction
• A stop-loss is executed by a condition (a level breaking), not by emotion
Entry points come from larger-timeframe support and resistance, and the volatility rhythm is read from the Bollinger Bands.
Do you see Bollinger Bands as a direction signal, or as a rhythm of volatility contracting and expanding?