
Why look at several timeframes
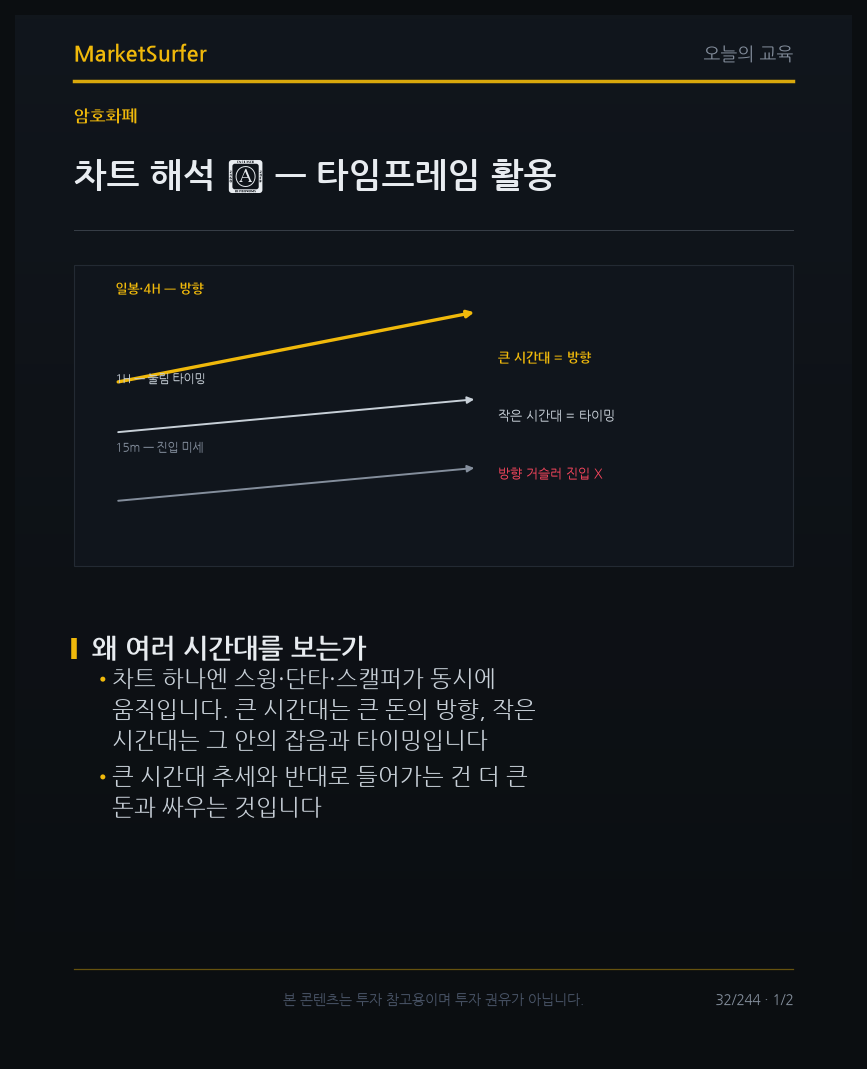
• A single chart has swing traders, day traders, and scalpers moving at once. The larger timeframe shows the direction of big money, and the smaller one shows the noise and timing inside it
• Entering against the larger-timeframe trend means fighting bigger money
So they are used this way
• The big picture (daily, 4-hour) decides 'which side to stand on'
• The small picture (1-hour, 15-minute) only catches the timing of 'entering cheaply', such as on a pullback
Where people slip
• They mistake the swings of a small timeframe for a 'trend' — it is noise inside the larger flow
• Without combining timeframes, either direction or timing is always missed
The big picture asks 'who is winning', the small picture asks 'when to get on'. The two have different roles.
Is the move you see on the smaller timeframe a trend or noise within the larger timeframe?