
Every timeframe needs its own trend reading
• The 4-hour, daily, weekly, and monthly charts each have their own trend — one conclusion must not be copied to every timeframe
• The three steps below are read separately for each timeframe, and the verdict of the big picture (the higher timeframe) takes priority
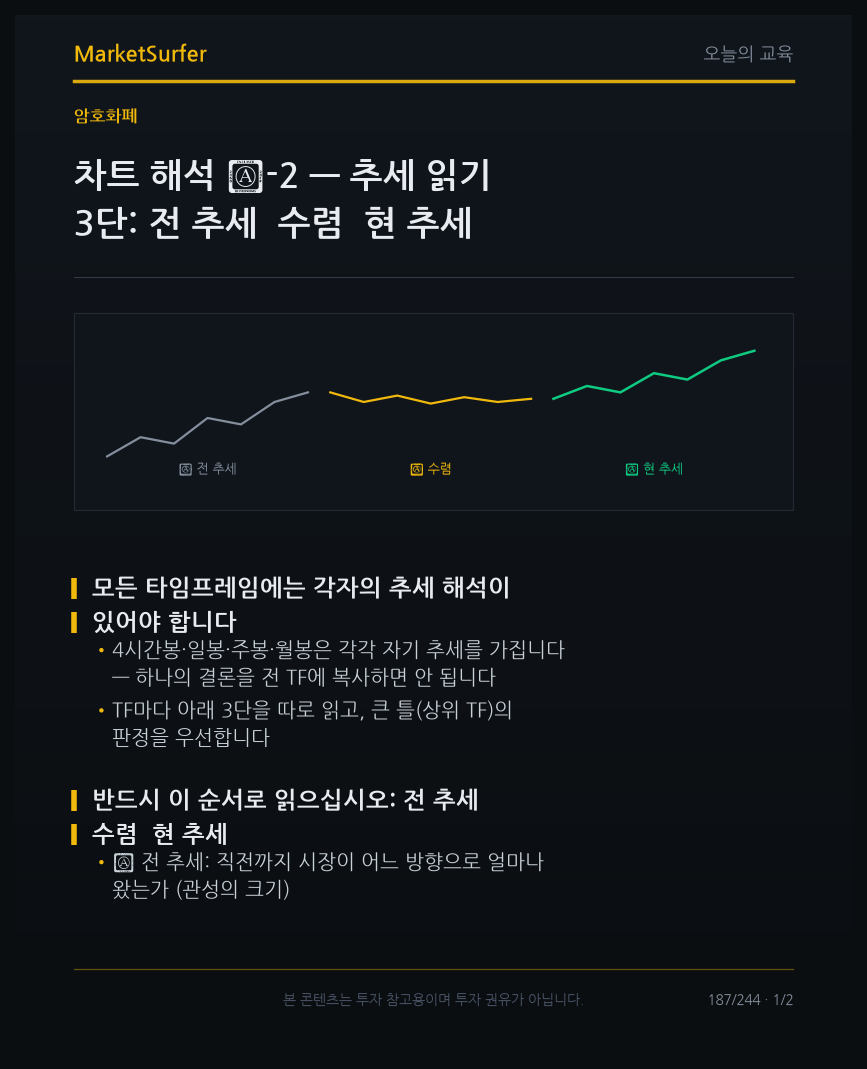
They are read in this order: prior trend → convergence → current trend
• ① Prior trend: in which direction and how far the market had come until just before (the size of momentum)
• ② Convergence: the stretch where that trend stops and the waves narrow — a zone of candidate reversals where energy compresses
• ③ Current trend: which way the convergence was resolved — the breakout direction and the confirmed close define the current trend
• A trend rarely flips directly without a convergence — missing the convergence means missing the reversal
Connection to our data
• MarketSurfer's candle-close trend reversal verdicts and volatility-imminent (convergence detection) alerts are the devices that automatically track steps ② → ③
Where people slip
• They declare a trend from just a few recent candles — a current trend read without the prior trend and convergence context is noise, not direction
On any timeframe, the same three questions are asked: where it came from (prior trend), where it rested (convergence), and which way it resolved now (current trend).
For the stock you are looking at now, can you explain its daily chart in the order prior trend → convergence → current trend?