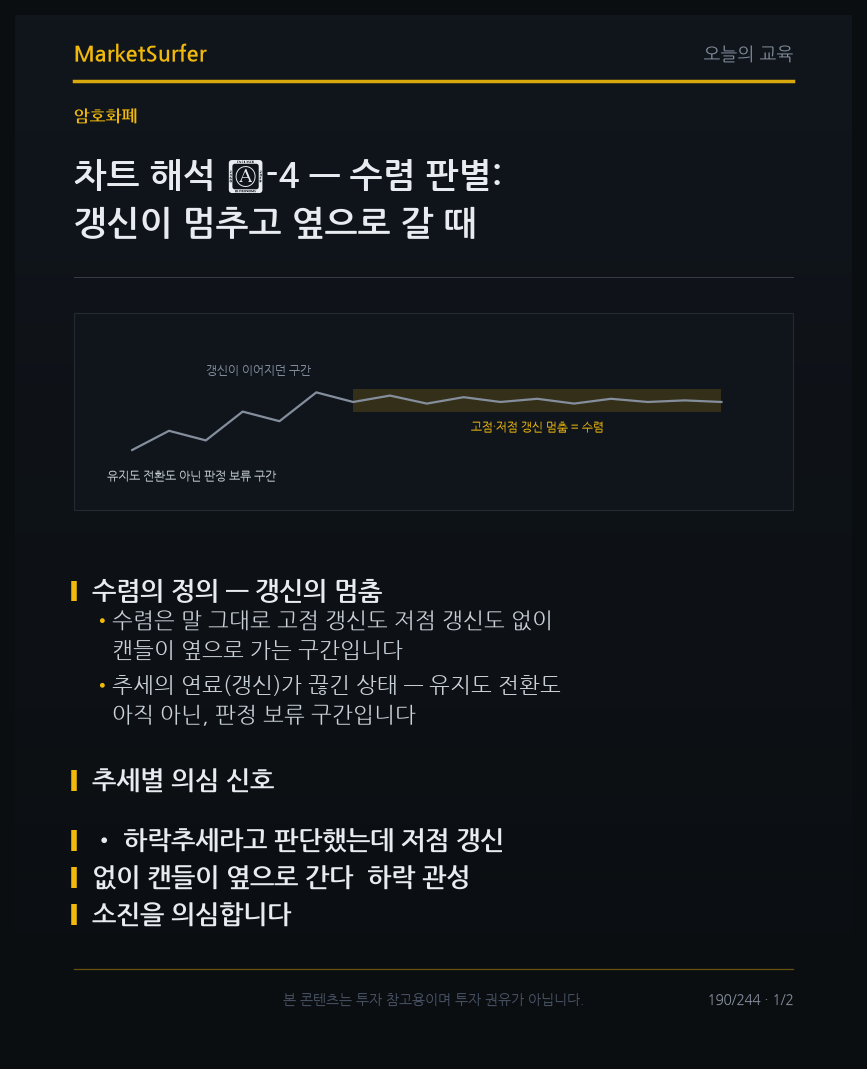

Defining convergence — no new highs or lows
• Convergence is a stretch where candles move sideways, making neither a new high nor a new low
• The fuel of a trend (new highs or lows) has been cut off — a stretch where judgment is pending, neither continuation nor reversal yet
What to suspect, by trend
• In a downtrend, candles go sideways without making a new low → suspect that the downward momentum is exhausted
• In an uptrend, candles go sideways without making a new high, and reversal-type candles such as a bearish engulfing or harami appear → suspect that the rise will not continue
• To move from suspicion to conviction — go down to the lower timeframe (LTF). The reversal structure is clearly more visible on the smaller timeframe (reaction runs from the small view to the big view)
Connection to our data
• MarketSurfer's volatility-imminent alert (contraction detection) automatically catches this 'sideways stretch', and the candle-close trend reversal verdict confirms the direction in which the convergence resolves
Where people slip
• Even after new highs or lows have stopped, they assume the existing trend continues and add to the position — convergence is not a sign of continuation but a signal for re-evaluation
When new highs and lows stop, judgment pauses. If in doubt, confirm the structure on the lower timeframe and wait for the candle close in the direction of resolution.
Have you ever noticed that a trend you were holding stopped making new highs or lows? How did you respond?